Graphical Analysisfor iOS
App info

Submit scientific data easily
Graphical Analysis for iOS is an application created for collecting and analyzing data received from all models of Vernier probes. It is widely used for easy viewing of laboratory projects by students. Users of mobile devices produced by Apple can establish a connection to all popular laboratory work interfaces.
Graphical Analysis is a powerful tool for working with analytic data
Using the LoggerPro or LabQuest2 interface with Graphical Analysis facilitates group work for students. Notwithstanding the conditions, each device connected to the interface receives a copy of the processed data package. The iOS version of the app brings powerful tools for working with information in wireless mode sensors. Today the number of supported sensors rapidly increases. Users can connect lab interfaces to it via Bluetooth or USB. It can be instrumental when working away from the university.
The function of delayed start is also available. Users can record data from various probes based on time markers or particular events. Such parameters as data sampling and experiment length are fully controllable in Graphical Analysis for iOS.
Compatibility with popular laboratory interfaces (like LabQuest Stream and Go Direct wireless sensors) expands the functionality of this program. Moreover, users can share the collected information with third-party analytic devices.
You don't need to do calibration of sensors when the function of a delayed recording start is turned on. It allows you to change the measurement units quickly and easily. The intuitive user interface of this program brings an ability to adjust all parameters of data collection.
Use Graphical Analysis with a maximum effect
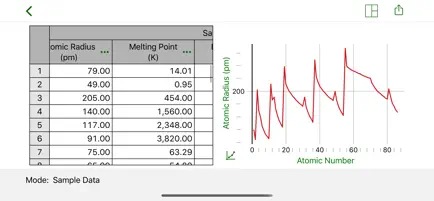
Graphical Analysis for iOS allows displaying the data in tables where the most important parts can be highlighted for additional clarity. It also offers algorithms for graphical data extrapolation and interpolation. The collected and processed data package can be sent to external devices and interfaces. Users can change the number of windows viewed on the screen with easy-in-use interface control tools. There are different types of coordinate axes available in this program. You can switch to the one you need with a single click.
The function of data column linearization helps analyze data collected from numerous probes. Graphical Analysis can work as a standalone app or as a browser extension. A user can set the individual parameters of data saving and export in the Settings section.
Should I download Graphical Analysis for iOS?
If you are looking for a powerful data analysis tool, Graphical Analysis is a program that will make you feel delighted. It works only on iOS devices but is compatible with most of Vernier's sensors.
It monitors various parameters and creates detailed reports containing tables, graphs, and other data visualization. Graphical Analysis offers powerful tools for results calculation. Users can save the obtained data anytime or transfer it to other interfaces for further processing. In this app, students can make annotations and display statistical information on the screen. You can turn on graphs and charts display mode when you need data visualization.
- A complete set of data analysis tools
- Customizable interface
- Quick data processing
- Large file size
- Works only on iOS-based devices
.jpg)
.jpg)